

Measure a task-level before-and-after time difference, annualize it using a documented frequency, and multiply by a supported hourly rate to estimate labor capacity value. That estimate is not proof of reduced spending or ROI. To assess net financial benefit, validate changes in spending and account for implementation and operating costs.
TL;DR:
Accurate ROI calculation requires measuring baseline task duration, volume, and error reduction over a fixed window with consistent variables.
Use a documented hourly labor rate to estimate the value of freed capacity. Keep that estimate separate from verified reductions in spending.
Collect data through manual logs, telemetry, or audit trails. Use a representative sample and report ramp-up effort separately from steady-state task performance.
Check for scope drift, double-counting, quality changes, and inconsistent treatment of ramp-up costs before reporting results.
Prioritize high-frequency, rule-based tasks for initial measurement to quickly establish credible savings before tackling more complex processes.
Table of Contents
What Formulas Convert Hours Saved Into Annual Savings?
The math behind quantifying time savings is not complicated. What trips people up is skipping steps or plugging in numbers that sound reasonable instead of numbers you actually measured.
Annualize the measured time difference using a documented task frequency and number of working weeks. Multiply those hours by a supported labor rate to estimate annual capacity value. Separately measure any reduction in error-related costs, taking care not to count the same benefit twice.
For a financial assessment, use verified spending reductions and other supported financial benefits. Subtract implementation and operating costs over a consistent period. Estimate payback from the timing of cumulative benefits and costs.
-
Annual hours saved = hours per instance × instances per week × 50
-
Estimated annual capacity value = annual hours saved × documented hourly labor rate
-
Simple payback (months) = initial cost ÷ monthly net cash benefit, only when benefits and costs are steady and there is no rollout delay
-
Three-year ROI (%) = (three-year financial benefits − total three-year costs) ÷ total three-year costs × 100
Treat the initial forecast as a scenario. Compare it with observed results after launch and explain changes in volume, coverage, exception handling, and operating cost before revising the estimate.
Include the cost of monitoring, maintenance, exception handling, training, and future changes in the evaluation. Use documented estimates initially and replace them with actual costs as they become available.
How Do You Define the Baseline Task You’re Measuring?
You cannot quantify time savings against a fuzzy target. If your task definition shifts halfway through measurement, every number downstream is contaminated.
Start by writing an operational task definition, not a job description. That means specifying the exact inputs (what triggers the task), the outputs (what “done” looks like), the acceptance criteria (how you know it was done correctly), and the boundaries (where this task ends and the next one begins). “Processing invoices” is not a task definition. “Matching a vendor invoice to a purchase order, flagging discrepancies over $50, and routing for approval” is.
-
Write the task definition in one sentence with a clear start and end point.
-
Pick a baseline window, ideally two to four weeks of typical volume, before any process change.
-
Freeze other variables during that window: same staff, same tools, same volume pattern, no parallel process changes.
-
Log every instance with a timestamp for start and finish, not a recalled estimate at the end of the day.
-
Repeat the same logging protocol post-change, using the identical task definition.
Task-level measurement beats role-level estimates because people are consistently bad at remembering how long something actually took. Someone who “thinks” a task takes 20 minutes is often off by 30% or more once you time it. The Strategized treats this gap as the single biggest source of inflated ROI claims, and recommends excluding the first several instances after any change entirely, since that period reflects learning curve, not steady-state performance.
Pro Tip: Log the baseline before you tell the team a change is coming. Once people know they’re being timed, or that a fix is on the way, behavior shifts and your “before” number quietly improves on its own.
How Do You Turn Saved Hours Into a Fully-Loaded Dollar Value?
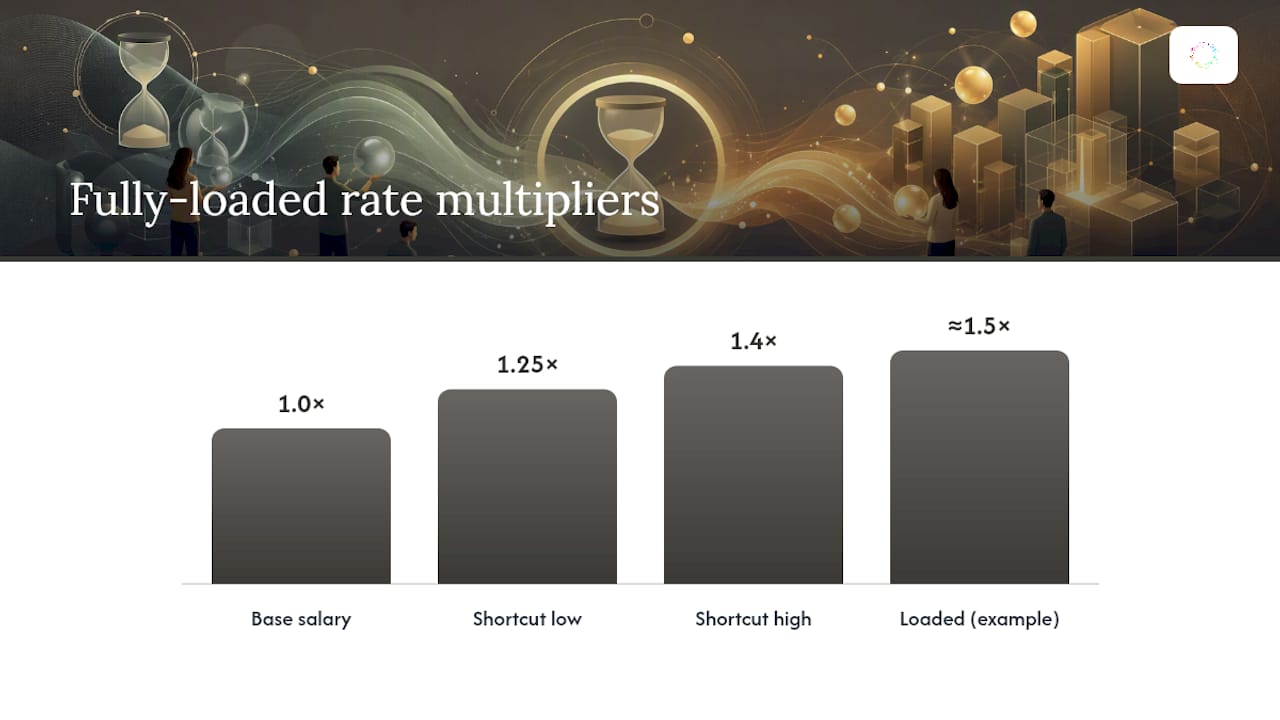
The hourly rate you plug into your formula is where most ROI claims quietly go wrong. Using someone’s base salary divided by 2,080 hours understates the real cost of their time by a wide margin, sometimes by half.
A fully-loaded hourly rate includes base wage, employer payroll taxes, benefits, and a reasonable allocation of overhead like office space, software licenses, and management overhead. A common shortcut is to take base salary and apply a multiplier between 1.25 and 1.4 to approximate the loaded rate, though finance teams with detailed cost accounting will have a more precise figure on hand. Ask payroll or finance for the actual loaded rate before you guess.
-
For general estimates across a team, use a standardized salary band average (finance or HR usually has this).
-
For a specific role you’re targeting, pull the actual loaded rate if you can get it. Precision here changes the final number meaningfully.
-
Public benefit-cost frameworks, including the Department of Transportation’s valuation guidance, favor conservative, documented rate assumptions over aggressive ones, and that same discipline holds up well in a corporate ROI deck.
-
Separate freed capacity, additional revenue, and reduced spending in your reporting. Reassigning time to billable work does not automatically reduce expense. Verify any spending reduction against business records and avoid counting the same benefit twice.
How Do You Collect Data That Holds Up to Scrutiny?
Bad data collection is the most common reason a time-savings claim falls apart under review. The fix is not more sophisticated math. It’s better logging discipline.
Three logging approaches work, each with tradeoffs. Manual task logs (a shared spreadsheet where people record start/stop times) are cheap and easy to start but rely on honesty and consistency. Automated telemetry, pulled from the software or platform running the task, removes human error but only works when the tool actually tracks timestamps at the task level. Audit trails from case management or ticketing systems sit in between, giving you timestamps you didn’t have to ask anyone to record.
-
Choose your logging method before the baseline window starts, and keep it identical for the post-change measurement.
-
Report ramp-up and steady-state performance separately. Include training and ramp-up costs in the full business case even when excluding that period from a steady-state task-duration comparison.
-
Set a minimum sample size before you trust the average. A handful of instances tells you almost nothing; dozens of repeated instances across different days and different people gives you a number you can defend.
-
Measure again at four weeks, then check in monthly for up to 12 months to confirm the savings hold as volume and staff change.
-
Flag any week with unusual volume, a system outage, or a process exception, and either exclude it or note it separately rather than letting it skew the average.
Statistic to know: The task-defined logging method from Strategized.ai specifically calls out minimum-sample and ramp-up exclusion as the two adjustments most often skipped, and the two most likely to get a reported savings figure challenged later.
What Mistakes Inflate or Distort Time-Savings Claims?
Most inflated ROI numbers aren’t dishonest. They’re the result of skipping a step under deadline pressure. Here’s what to watch for.
-
Scope drift: the task you measured in the baseline isn’t quite the task you’re measuring after the change, so the comparison is apples to oranges.
-
Mixing ramp-up and steady-state results: including slower post-change work raises average task duration and ordinarily decreases estimated time savings. Report startup effort separately, while retaining its costs in the total business case.
-
Double-counting: the same hours get claimed in two different automation initiatives because nobody checked for overlap.
-
Quality trade-offs: a task got faster because a review step got cut, and the rework it eventually generates never makes it back into the math.
Public-interest critiques of value-of-time claims make the same point in a different context: valuation assumptions are often contested, and the guides that survive scrutiny document every assumption instead of hiding behind a single clean number.
Pro Tip: Present a range, not a point estimate, the first time you report savings to leadership. “$40,000 to $55,000 annually, based on a 30-day sample” reads as more credible than a suspiciously precise “$47,238,” even though the second number looks more scientific.
Which Tools and Templates Make This Easier to Track?
You don’t need custom software to quantify time savings correctly. A well-built spreadsheet handles most of this work.
A compact template needs four input columns: task name, instance date, start time, and finish time, with a fifth column that auto-calculates duration. A second tab converts weekly totals into annual hours using the formulas above, then applies your fully-loaded rate to produce a running dollar total. Build in a column for exceptions or notes so you can exclude an outlier without deleting the data point entirely.
-
Manual spreadsheets work well for pilot measurements and small teams; the tradeoff is that someone has to remember to fill them in.
-
Process-logging tools built into ticketing or case management platforms remove the manual step but only capture what the underlying system already timestamps.
-
ROI calculators, like the one from Techsy, are useful for a first-pass estimate before you invest in a build, but they run on assumed inputs, not measured ones, so treat the output as a planning number, not a final claim.
If you’re running actual automation software, export its execution logs directly into your tracking spreadsheet rather than re-timing tasks by hand. A platform log with timestamps and outcomes gives you a larger, cleaner sample than manual logging ever will.
Worked Example: One Task, From Definition to Dollars
Take a task defined as “reconcile daily sales report against the point-of-sale system and flag discrepancies.” Baseline measurement, logged over three weeks: 22 minutes per instance, done five times a week.
-
Annual hours before: 22 minutes × 5 × 50 weeks ÷ 60 = 91.7 hours per year.
-
After a process change, the same task, measured over four weeks excluding the first two ramp-up weeks: 6 minutes per instance.
-
Annual hours after: 6 minutes × 5 × 50 ÷ 60 = 25 hours per year.
-
Hours saved annually: 66.7 hours.
-
Estimated annual capacity value: (22 − 6) minutes × 5 instances × 50 weeks ÷ 60 × $38/hour = approximately $2,533, before implementation and operating costs. This is an illustrative estimate, not an Orchard customer result or confirmed reduction in spending.
Statistic to know: Apply a conservative discount before you report this.
How Orchard Supports Auditable Time-Savings Measurement
Use Orchard’s available activity and evidence to investigate a candidate workflow. For any savings estimate, document the manual baseline, completed automation runs, labor rate, review effort, and exceptions.
Check that the observations cover the task and a representative period. Keep measured inputs distinct from assumptions and modeled results.
-
Keep estimated capacity value separate from actual changes in spending.
-
Validate reductions in overtime, contractor costs, or other expenses against the relevant business records.
-
Include implementation and operating costs when evaluating net benefit.
Record the source, period, scope, and assumptions for each input so another reviewer can trace the estimate. Request an Orchard briefing to discuss the activity and evidence available for your workflow.
A Manager’s Take: Where to Start Measuring First
Start with the highest-frequency, most rule-based task on the list. A task done 200 times a week with a clean acceptance criterion will give you a credible number faster than a complex, judgment-heavy process ever will, and it builds the case for measuring harder problems later.

When you present numbers upward, lead with the baseline window, the sample size, and the discount you applied. Skip the guardrails and someone in finance will ask about them anyway, just later and with less trust in the rest of your deck.
Prove the method on one task before you scale it across a department. Structured, sequenced automation programs that build credibility on early wins tend to get the budget and patience needed to tackle the messier, higher-value processes down the line.
— Katie
Sources
Recommended
-
Orchard | Employee Monitoring & Workforce Analytics