

Automation ROI (%) = (financial benefits − total costs) ÷ total costs × 100, using the same evaluation period for both benefits and costs. Payback is the point when cumulative benefits cover cumulative costs. A monthly schedule is needed when rollout delays or changing costs affect that timing.
Begin with the task’s measured effort and frequency, a documented labor rate, and estimates of implementation and operating costs. Identify which benefits would reduce spending and which would free capacity. Record the assumptions before estimating ROI.
-
Annual baseline hours × documented hourly labor rate = estimated annual labor capacity value of the task
-
Estimated build cost + Year-1 recurring costs = your investment side of the equation
-
Net financial benefit = supported financial benefits minus all implementation and operating costs over the same period
The rest of this guide turns that rough math into something a CFO won’t push back on: hard versus soft savings, full lifecycle cost, capture rate, and sensitivity ranges that hold up under scrutiny.
Key Takeaways
Automation ROI holds up under finance scrutiny only when it separates hard savings from soft savings and accounts for full lifecycle cost, not just build price.
| Point | Details |
|---|---|
| Use the core formula | ROI (%) = (financial benefits − total costs) ÷ total costs × 100. Determine payback from cumulative monthly benefits and costs. |
| Split hard from soft savings | Only savings that reduce actual spend belong in an EBITDA-impact case for finance review. |
| Budget for full TCO | Include build, integration, training, licensing, monitoring, maintenance, and exception handling; estimate costs for the specific workflow. |
| Run three scenarios | Present best, base, and conservative cases so payback ranges survive sensitivity questions. |
| Use real baseline data | Use Orchard’s available activity and evidence to investigate the workflow. Confirm scope and assumptions before treating observations as model inputs. |
Table of Contents
What Is Automation ROI and Why Does It Matter?
Automation ROI measures the financial return an automated process generates relative to what it costs to build and run. It sounds simple until you try to defend the number in a budget meeting, because the real work is deciding what counts as a benefit and what counts as a cost.
Separate reduced spending, additional revenue, and freed capacity. Fewer paid overtime or contractor hours may reduce spending when confirmed in business records. Reassigning time to billable work may create revenue, but does not itself reduce expense. Do not count the same benefit more than once.
| Metric type | What it measures | When it matters most |
|---|---|---|
| Hard ROI (EBITDA impact) | Actual reduction in spend: overtime, contractors, headcount | CFO review, capital approval, board reporting |
| Soft ROI (capacity/efficiency) | Hours freed up for other work | Team prioritization, workload planning |
| Payback period | Months until net benefit covers investment | Procurement decisions, comparing project options |
| NPV / discounted cash flow | Present value of future savings adjusted for time | Multi-year capital projects, competing capital requests |
You need automation ROI figures at three decision points: when you’re deciding whether to fund a project, when you’re ranking multiple automation candidates against each other, and when finance asks you to justify the spend a quarter or a year later. Each of those audiences wants a slightly different cut of the same numbers.
Two reference points help ground your estimate before you build a model. Bureau of Labor Statistics wage data gives you defensible industry pay benchmarks if you don’t have internal loaded-rate figures handy. And the general practice of building a full total cost of ownership, rather than just a license price, is what separates a credible automation business case from a vendor’s marketing math.
Core ROI Formula and What Belongs in the Calculation
Use consistent definitions and a stated evaluation period. Gross financial benefits, total costs, and net benefit are different quantities:
-
ROI (%) = (Net Benefit ÷ Total Cost) × 100
-
Simple payback (months) = initial cost ÷ monthly net cash benefit, only under steady monthly conditions with no rollout delay
-
Net Benefit = supported financial benefits − all implementation and operating costs over the evaluation period
One distinction trips up a lot of first-time models: Year-1 ROI and steady-state ROI are not the same number. Year-1 absorbs the full build cost against a partial year of benefits, since most automations ramp up over weeks or months rather than delivering full value on day one. Steady-state ROI, calculated from Year 2 onward, only carries recurring costs against a full year of realized savings, and it’s almost always a much better-looking number. Present both. A project that looks mediocre in Year 1 but strong at steady state is a completely different pitch than one that’s mediocre both years.
Benefits worth quantifying
-
Reclaimed labor hours: time no longer spent on the manual version of the task, valued at loaded hourly rate
-
Reduced errors and rework: fewer corrections, fewer customer complaints, less time spent fixing mistakes downstream
-
Throughput or revenue lift: cases processed faster, orders shipped sooner, capacity to take on more volume without adding headcount
-
Avoided hires: growth absorbed without adding a position you would otherwise need
-
License or tool consolidation: retiring redundant software once the automation replaces its function
-
Reduced penalties: fewer compliance misses, late fees, or SLA breaches
Costs and investment that belong in the model
-
One-time build cost: development, configuration, or platform setup
-
Integration and data work: connecting systems, cleaning data, mapping fields
-
Training and change management: time spent getting the team to adopt the new process
-
Recurring license and infrastructure: subscription fees, cloud hosting, compute
-
Monitoring and maintenance: estimate the labor and service costs needed to keep this specific workflow running and verify them after launch.
-
Exception handling: the residual human labor still required for cases the automation can’t resolve
-
Contingency: a buffer for the inevitable scope creep and integration surprises
| Benefit type | How to measure it | Typical data to collect |
|---|---|---|
| Labor hours reclaimed | Time studies or timestamped task logs before and after | Minutes per task, tasks per week, headcount involved |
| Error/rework reduction | Error rate before and after, cost per error corrected | Defect counts, rework hours, customer complaint volume |
| Throughput/revenue lift | Volume processed per period, capacity headroom created | Cases per day, order cycle time, backlog size |
| Avoided hiring | Headcount growth model with and without automation | Projected headcount need, average fully loaded salary |
| Tool consolidation | License costs eliminated once automation replaces function | Number of seats retired, annual license spend |
Emerson’s white paper on calculating automation ROI takes the industrial version of this seriously, treating capital expenditure and yearly operating costs as separate line items rather than lumping them into a single number. That same discipline applies whether you’re automating a factory floor process or a back-office workflow.
How Do You Calculate Automation ROI Step by Step?
-
Measure the baseline. Track how many hours the current manual process actually takes, per unit of work, over a representative period. Don’t estimate from memory; pull timestamps or run a short time study.
-
Determine automation coverage. Test which cases the automation handles successfully without human intervention. Document exceptions and validate the result on a representative sample rather than assuming a standard coverage percentage.
-
Estimate the exception rate. The residual cases still needing manual handling. This number directly reduces your net benefit, and it’s the assumption most new models get wrong.
-
Convert time savings to dollars. Multiply hours reclaimed by your loaded hourly rate, then apply a hard capture rate, the portion of that time that actually reduces spend rather than just freeing up capacity.
-
Total the full cost. Add one-time build, integration, training, and Year-1 recurring costs.
-
Calculate net benefit and ROI. Subtract total cost from gross benefit, then divide by total cost and multiply by 100.
Illustrative example: a process consumes 100 manual hours per month at $45/hour. Assume automation removes 80% of that effort and 85% of the resulting labor value becomes an actual spending reduction. The second assumption requires evidence; it is not guaranteed by automation.
Monthly gross benefit after launch is $4,500 × 80% × 85% = $3,060 under these illustrative assumptions.
Assume a $15,000 initial build cost, $4,000 in first-year operating costs, and three months with no benefit before launch. Nine benefit-producing months yield $27,540. First-year net benefit is $8,540, and ROI is $8,540 ÷ $19,000 × 100 ≈ 45%.
Calculate payback from cumulative monthly cash flows, including the ramp period and the timing of operating costs. These figures illustrate a calculation; they are not Orchard customer results.
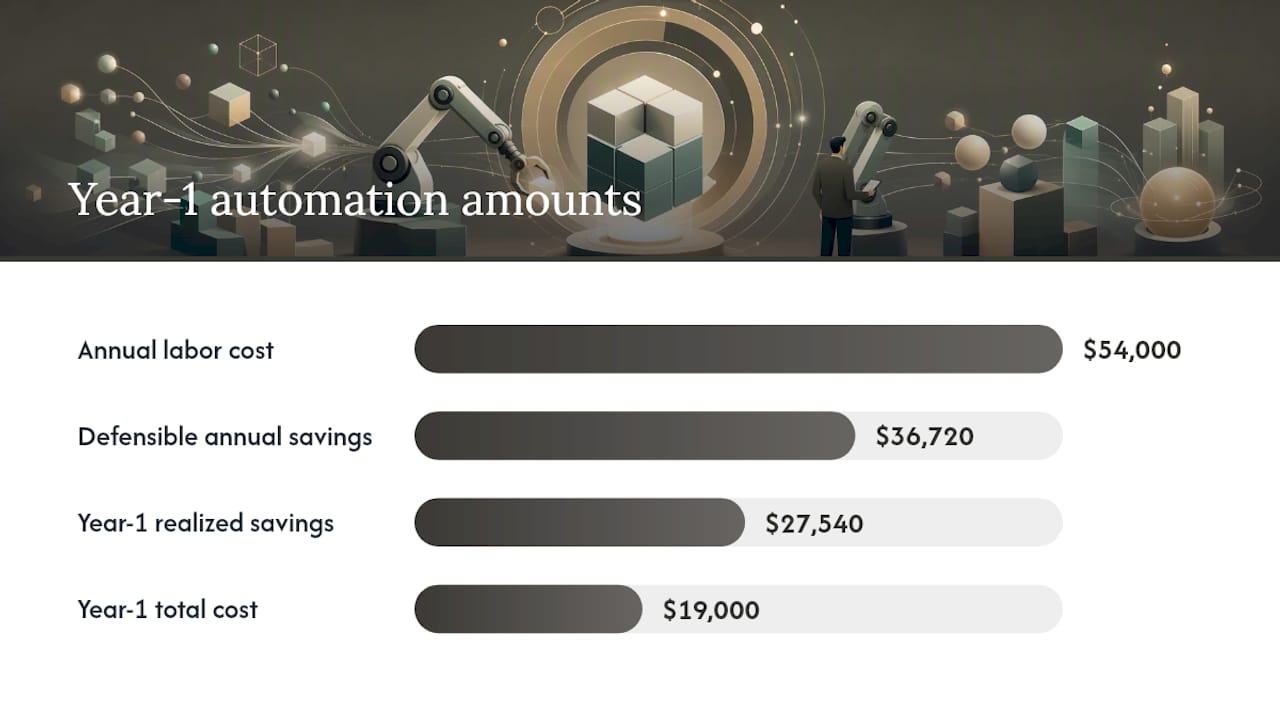
Test alternative coverage, capture, volume, and cost assumptions using the same definitions. No payback benchmark substitutes for evidence about the workflow being evaluated.
Three scenarios to run before you present a number
-
Best case: use supported assumptions for higher coverage or faster rollout, retaining all relevant costs.
-
Base case: use the most supportable scope, volume, cost, and rollout assumptions, and document the basis for each.
-
Conservative case: test lower coverage, slower rollout, more exceptions, and higher operating costs. Recalculate from the same monthly schedule.
Present all three to finance rather than a single number. A single confident figure invites skepticism; a range with clearly labeled assumptions invites trust.
Payback Period, Discounting, and Sensitivity Testing
Payback occurs when cumulative benefits cover cumulative costs. A simple initial-cost divided by monthly-net-benefit formula is useful only when benefits and costs follow its timing assumptions. Use a monthly schedule when rollout delays or changing costs matter.
Simple payback does not account for the time value of money or benefits after the payback date. Use the evaluation method and discount rate agreed with finance, particularly when comparing projects with different timing or risk.
Sensitivity analysis is where most ROI models either earn credibility or lose it. Test how payback and ROI shift when you flex:
-
Process volume (what happens if ticket count drops 20%, or grows 50%?)
-
Wage changes (a raise cycle or shift to a higher-cost labor pool)
-
Exception rate (what if residual manual work runs higher than estimated?)
-
Maintenance as a percentage of build cost (10% versus 20% changes steady-state ROI meaningfully)
-
Ramp/stabilization period (a slower rollout pushes payback out regardless of the underlying math)
Pro Tip: Report two payback numbers side by side: one using only certified, hard-dollar savings, and one using total value including soft capacity gains. Finance will ask for the first number anyway, and offering it up front builds more trust than making them dig for it.
What Factors Change Expected Automation ROI?
Not every automation candidate returns the same ROI, and the gap between a great candidate and a mediocre one usually comes down to a handful of variables.
-
Process volume: higher-frequency tasks accumulate savings faster and hit payback sooner
-
Hourly wage of the role involved: automating a $75/hour analyst’s manual work returns faster than automating a $20/hour data-entry task, even at identical time savings
-
Complexity and integration effort: more systems to connect means more build cost and more fragile maintenance
-
Exception rate: every case that still needs a human erodes the net benefit
-
Degree of human judgment required: tasks with clear rules automate cleanly; tasks requiring nuanced decisions need more exception handling built in
-
Regulatory or compliance overhead: audit trails and approval steps add build cost but can also avoid penalty costs
-
Frequency of process change: a process that changes every quarter needs more maintenance, which quietly erodes steady-state ROI
Process volume and labor rate affect estimated capacity value. Financial payback also depends on how much spending actually changes, implementation costs, operating costs, and the rollout schedule.
Pro Tip: When estimating automation coverage, ask the team doing the work “what percentage of cases follow the exact same steps?” rather than “can this be automated?” You’ll get a more honest answer, and it usually lands lower than the optimistic number a vendor demo suggests.
What Are the Most Common ROI Measurement Pitfalls?
Most inflated ROI numbers aren’t dishonest, they’re just missing pieces. The common failure modes:
-
Counting 100% of time saved as cost savings, when only the portion that reduces actual spend (the hard capture rate) belongs in an EBITDA-impact case
-
Ignoring maintenance and total cost of ownership entirely, which makes Year-1 numbers look far better than steady-state reality
-
Underestimating the exception rate, especially for anything involving judgment calls or unusual inputs
-
Double-counting benefits, like claiming both “hours saved” and “revenue lift” from the same freed-up capacity
-
Skipping ramp and stabilization time, assuming full value from day one of launch
-
Forgetting ongoing monitoring costs, which quietly show up six months in
Review missing cost categories, unsupported benefit assumptions, and unexplained rollout timing before presenting the model. A short payback estimate needs evidence, just as a longer one does.
Pro Tip: Before presenting your model, run a sanity check: does your claimed payback period beat the vendor’s own stated average? If your number looks better than reported industry benchmarks for similar automations, something in your cost side is probably missing.
Best Practices for Tracking Automation ROI After Launch
Getting the pre-launch number right is only half the job. Sustaining it requires the same discipline applied on a schedule.
Start by prioritizing correctly: target high-volume, rule-based, high-wage tasks first, since that combination produces the fastest and most defensible payback. Once live, track a consistent set of KPIs:
-
Run-rate savings against the original projection
-
Exception rate compared to the assumption used in the model
-
System uptime and mean time to resolve incidents
-
Maintenance spend and staff effort compared with the documented operating budget
-
Volume trends that might shift the ROI in either direction
Governance matters more than most teams expect. Put change control around the automation so nobody modifies the underlying process without a review. Run regression testing after any update to catch new exception cases before they pile up. And revisit the ROI model itself every quarter, not just at launch, comparing real numbers against the original assumptions and adjusting the business case accordingly.
How Orchard Captures the Inputs for a Defendable ROI Model
Every formula above depends on accurate baseline data, and that’s usually the hardest part to get right. Most teams estimate task duration from memory, which is exactly where inflated ROI claims start.

Start with the activity and evidence available for the workflow being evaluated. Confirm what each observation measures before using it as a financial-model input. A repeated sequence does not by itself establish automation coverage, a successful outcome, or reduced spending.
For each input, record its source, period, scope, and assumptions. Validate task boundaries and exceptions with the people responsible for the work. Add implementation and operating costs, and keep measured inputs distinct from estimated benefits.
-
Confirm what each source records and whether its timestamps and outcomes support the task definition.
-
Validate which cases were completed successfully and which required manual work; do not infer this from repetition alone.
-
Verify the data covers a representative period, not just a slow week
Review observations and assumptions together. A platform record is useful evidence only when its meaning, coverage, and limitations match the question being evaluated.
What Should You Automate First to Maximize ROI?
Automate the highest-volume, most rule-based, highest-wage task on your list first. That combination produces payback fast enough to fund the next project, and a quick win buys you credibility for harder automations later.
Treat this as a financial decision before it’s a technical one. A team can build a technically impressive automation for a low-volume, low-wage task and still produce a weak business case. The engineering difficulty and the financial return are only loosely related, and confusing the two is how automation budgets get cut.
Align your measurement cadence with your procurement cycle. If budget reviews happen quarterly, re-validate your ROI model quarterly, not just once at launch. Numbers that only get checked at the one-year mark tend to drift quietly in the wrong direction.
Get a Faster, Data-Backed ROI Estimate
A useful business case still requires judgment about scope, exceptions, costs, and how any freed capacity will be used. Orchard’s available activity and evidence can support that investigation; they do not eliminate the need to validate assumptions.

Request an Orchard briefing to discuss the evidence available for your workflow and the assumptions an evaluation would need to test. Review Orchard’s security and data-handling information alongside your evaluation.
Frequently Asked Questions
What is a good ROI for an automation project? There is no universal target. Agree the evaluation period, cost categories, evidence requirements, and decision criteria with the people responsible for the budget.
How do you calculate automation cost savings? Compare actual spending before and after the change over a consistent period, adjusting for volume and other relevant changes. Include implementation and operating costs when reporting net benefit. Hours multiplied by a labor rate estimate capacity value, not automatically reduced spending.
Should I include soft savings in my ROI calculation? Report freed capacity separately from spending reductions and additional revenue. Reassigning work to billable activities does not automatically reduce expenses. Use supported financial benefits in the financial ROI calculation.
What’s a realistic payback period for automation? Calculate it from the workflow’s supported benefits, costs, and rollout schedule. Scope, exception handling, adoption, and the timing of actual spending reductions can change the result.
How much should I budget for automation maintenance? Estimate monitoring, fixes, vendor or system changes, and exception handling for the specific workflow. Compare those estimates with actual operating costs after launch.
Sources
Recommended
-
Orchard | Employee Monitoring & Workforce Analytics